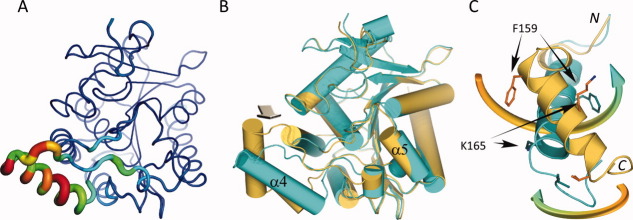
Figure 6.
Flexible region in MGL and ligand binding induced conformational changes. A: Variability of structural elements in MGL as defined by the average distance of Cα positions across all published MGL structures. Average distances of superimposed and matching Cα-atoms are mapped onto a “putty” cartoon representation of MGL. The average distances are color coded from blue (lowest average distance) to red (highest average distance) and represent values from 0.086 Å to 4.5 Å. The same values are also encoded in the radius of the cartoon. B: Overlay of the mutant MGL (cyan) in complex with Compound 1 and apo MGL (dark yellow, PDB ID 3HJU , chain A). The superposition is almost identical for large parts of the molecule, except for a region surrounding α-helix 4 with its connecting loops and the loop linking α-helix 5 and α-helix 6. The arrow indicates the approximate viewpoint assumed in panel C. C: Panel illustrating the rearrangement of α-helix 4. The movement of α-helix 4 from the open to the closed position is characterized by a concomitant rolling motion over the active site opening and an almost 180° counter-clockwise rotation (viewed from C to N-terminus). The movements are indicated by colored arrows, corresponding residues in both structures representing the start and endpoint of the transition are indicated as well. Less pronounced changes are observed in the flanking loop regions during the transition. α-Helix 5, which is also part of the lid-domain, displays only a modest amount of movement.

