
Figure 3.
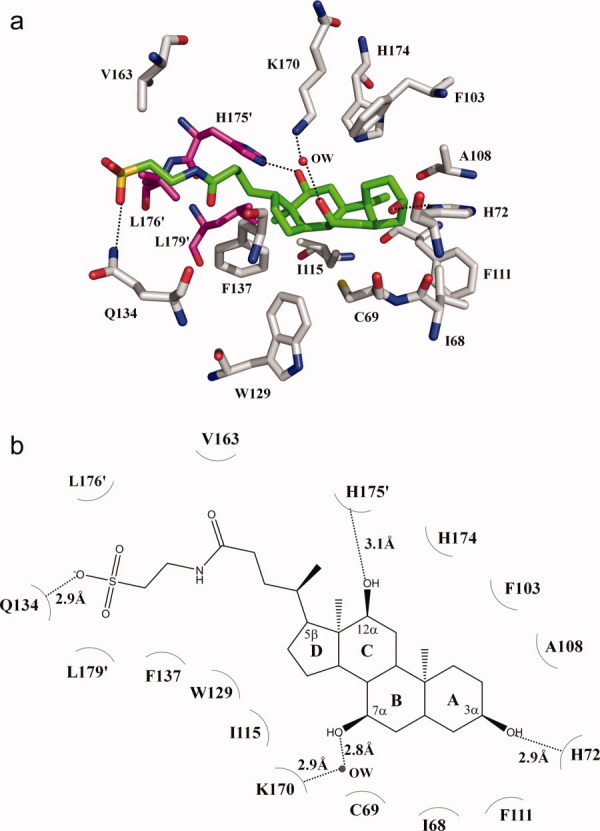
The taurocholate binding site. (a) Amino acid residues within 4.2 Å from the bound taurocholate (green, carbon; blue, nitrogen; red, oxygen; orange, sulfur). The side chains of selected residues are shown as gray sticks (gray, carbon; blue, nitrogen; red, oxygen). Residues from the next subunit of CmeR are shown as magenta sticks (magenta, carbon; blue, nitrogen; red, oxygen). A water molecule (OW) hydrogen-bonded with the bound taurocholate is shown as red sphere. (b) Schematic representation of the CmeR and taurocholate interactions shown in panel a. Dotted lines depict the hydrogen bonds. The hydrogen-bonded distances are also indicated in this figure.