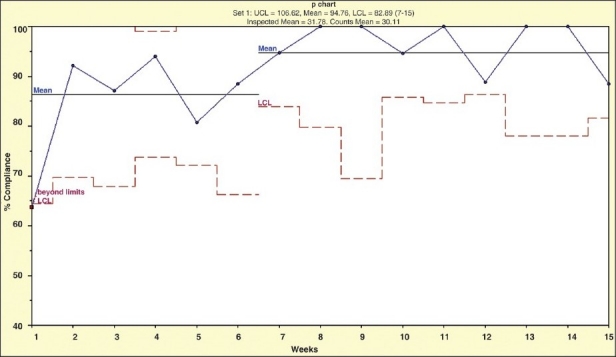
Figure 1.

A run chart showing the weekly compliance rate with DVT prophylaxis. The X-axis shows the time of the study (weeks) and the Y-axis shows the compliance rate. The dotted lines show the lower control limits and the straight lines show the mean compliance rates at the beginning and end of the study
