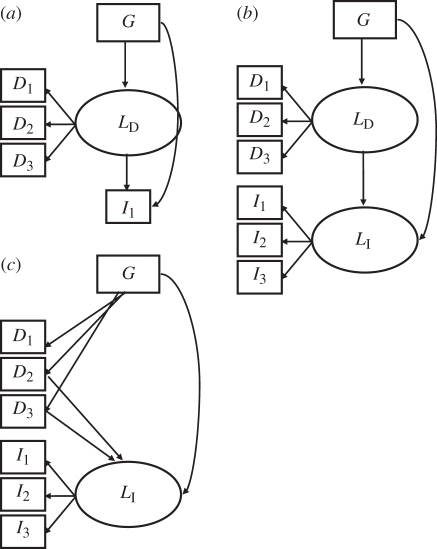
Figure 2.
Examples of structural equation models (SEMs) for phenotypic interactions underlying indirect genetic effects. Each box represents a measured variable: G, the QTL genotype of the focal plant; Dn, the direct or focal plant traits; In, the indirect or neighbour plant traits. Each oval represents a latent variable or factor formed by the variables whose arrows are directed outward from the variable: LD, a direct or focal plant trait factor; LI, an indirect or neighbour plant trait factor. (a) Simple model where there is a direct latent variable composed of focal plant traits that influence some indirect trait. This is analogous to the indirect trait being incorporated into the direct latent factor. (b) The case where a host of focal plant traits (D1–3) form a latent factor, which influences a neighbour plant factor, formed by its traits (I1–3). Finally, (c) a case where a neighbour factor is affected by some of the focal plant traits, but not all. Each of these models is considered an ‘unidentified pleiotropy’ model, and can be reduced to an ‘identified pleiotropy’ model by removing the path from G to the indirect trait or factor.

