
Table 1.
Results of a simulation emulating genetic variation in growth rates for Xysticus spiders embedded in a complex leaf-litter forest-floor food web.
| Ra | population | predator–preyb |  |
CV-OPd |  |
CV-ROPf | links | cannibalismg |
|---|---|---|---|---|---|---|---|---|
| 1 | high genetic variation | predator | 407.9 (5.6) | 56.6 | 2994 (4.3) | 109.1 | 13 | 30 575 (20.9) |
| prey | 1458.3 (20) | 60.7 | 443.3 (20.4) | 126.5 | 20 | |||
| low genetic variation | predator | 416.3 (5.7) | 62.9 | 3062.7 (4.4) | 127.9 | 12 | 31 646 (21.7) | |
| prey | 1479.2 (20.3) | 61.8 | 451.5 (20.7) | 127.2 | 20 | |||
| 2 | high genetic variation | predator | 247.8 (3.4) | 118.1 | 1176.1 (1.7) | 64.7 | 8 | 10 836 (7.4) |
| prey | 1358.8 (18.6) | 75.0 | 332.7 (15.3) | 131.0 | 20 | |||
| low genetic variation | predator | 277.5 (3.8) | 130.2 | 803.4 (1.1) | 106.2 | 6 | 2635 (1.8) | |
| prey | 1137.5 (15.6) | 82.2 | 336.7 (15.5) | 143.0 | 20 | |||
| 3 | high genetic variation | predator | 192.7 (2.6) | 156.5 | 530.7 (0.8) | 141.5 | 7 | 4282 (2.9) |
| prey | 937.6 (12.8) | 32.4 | 260.3 (12) | 129.2 | 20 | |||
| low genetic variation | predator | 455.7 (6.2) | 82.2 | 1159.9 (1.7) | 82.6 | 3 | 145 (0.1) | |
| prey | 870.4 (11.9) | 95.0 | 229.4 (10.5) | 127.5 | 20 | |||
| 4 | high genetic variation | predator | 285.5 (3.9) | 110.5 | 746.6 (1.1) | 106.5 | 4 | 1946 (1.3) |
| prey | 799.8 (11) | 94.8 | 211.7 (9.7) | 126.5 | 20 | |||
| low genetic variation | predator | 603.5 (8.3) | 13.7 | 1543.6 (2.2) | 13.6 | 2 | 0 (0) | |
| prey | 743.2 (10.2) | 108.0 | 188.6 (8.7) | 126.9 | 20 |
aPredator–prey body size ratio beyond which predation can occur.
bWhether Xysticus acts as potential predator (potential generality) or as potential prey (potential vulnerability).
cOpportunity for predation averaged across species pairs (see text). Shown between parentheses are percentage  relative to the maximum possible (i.e.
  = days in the season × number of genotypes = 365 × 20 = 7300).
dCoefficient of variation among OPis (see text).
eRelative opportunity for predation after accounting for species abundances (see text). Shown between parentheses is the percentage  relative to the maximum possible, the latter differing depending on whether the target population acts as predator or as prey (i.e. as predator,
 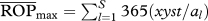 , where xyst is Xysticus abundance and al is the abundance of the lth predator; as prey,
 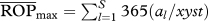 . These figures were 69 873 and 21 873, respectively.
fCoefficient of variation among ROPis (see text).
gIntraspecific opportunity for predation. Again, between parentheses is the percentage relative to the maximum (i.e. 365 days × 20 genoypes × 20 genotypes = 146 000).