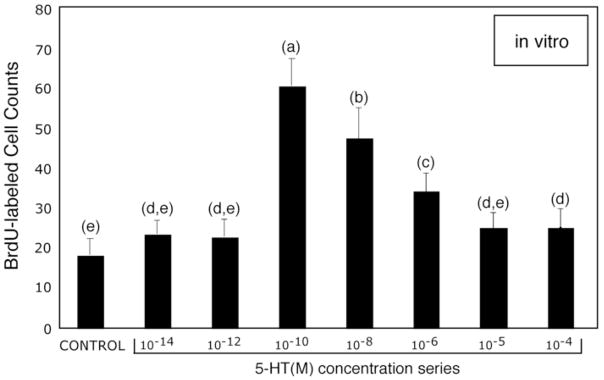
Fig 5.
Dose-response curve for serotonin and levels of adult neurogenesis in Cluster 10 of in vitro lobster brains. The graph of BrdU-labeled cell counts vs. serotonin levels (10−14M – 10−4M) demonstrates that the rate of cell proliferation in Cluster10 is most sensitive to neurohormonal levels (10−8M – 10−10M) of this amine. ANOVA (F=78: p = < 0.0001) followed by Tukey-Kramer HSD (p= <0.05), reveals significant differences at serotonin levels 10−10 – 10−6 M relative to control brains. Statistical similarity is indicated by the same letters. n=10 per group for each serotonin concentration and control.

