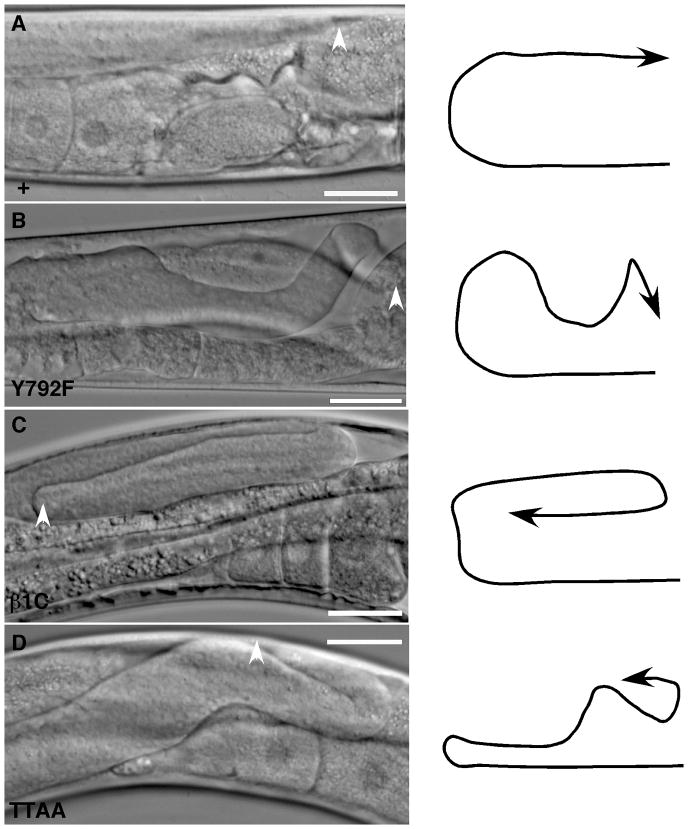
Figure 5. βpat-3 transgenic animals display DTC migration defects.
Normal DTC migration in a (A) βpat-3 (+) rescued animal in contrast to the (B) βpat-3(Y972F), (C) βpat-3(β1C), and (D) βpat-3(TTAA) rescued lines, in which the DTC (arrowhead) follows an incorrect migratory path. The path taken by the DTC is indicated by the arrow diagrams. In all panels, vulva is located on the bottom right corner. Scale bars = 40 μm.

