
Figure 3.
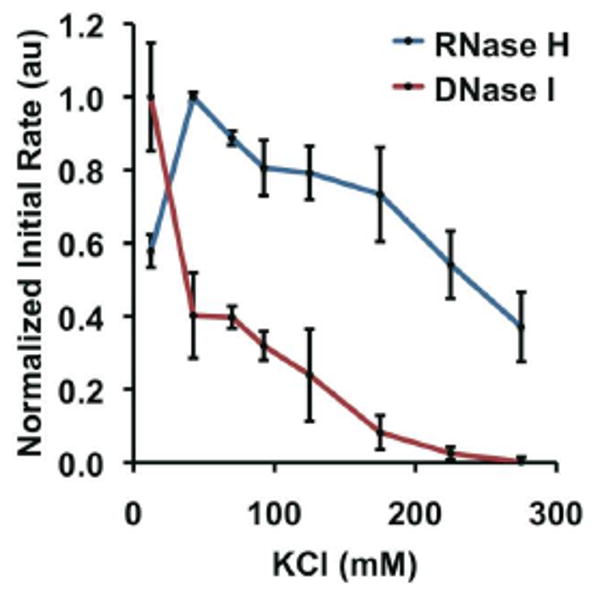
Salt-sensitivity of RNase H (blue) and DNase I (red). Each point represents the normalized initial rate of substrate degradation; the errors bars represent the standard error from three independent experiments.
Official websites use .gov
A
.gov website belongs to an official
government organization in the United States.
Secure .gov websites use HTTPS
A lock (
) or https:// means you've safely
connected to the .gov website. Share sensitive
information only on official, secure websites.
Salt-sensitivity of RNase H (blue) and DNase I (red). Each point represents the normalized initial rate of substrate degradation; the errors bars represent the standard error from three independent experiments.