
Figure 4.
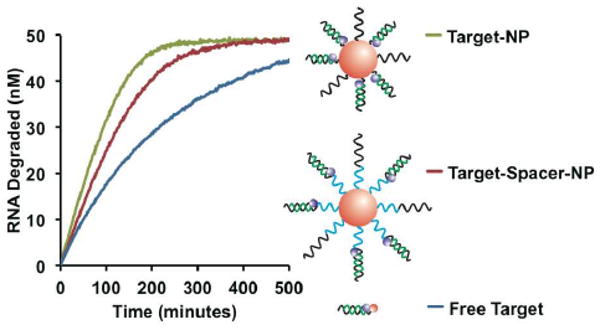
Role of local substrate density on reaction rate. Progress curves for three substrates were compared, free target (blue), target bound to an Au NP through a P10 spacer (red), and the target bound directly to the Au NP surface (green). Schematic diagrams of each substrate are shown with the position of the spacer highlighted in blue. As in previous schemes, DNA and RNA are depicted in black and green respectively. Each curve represents the average from three independent experiments.