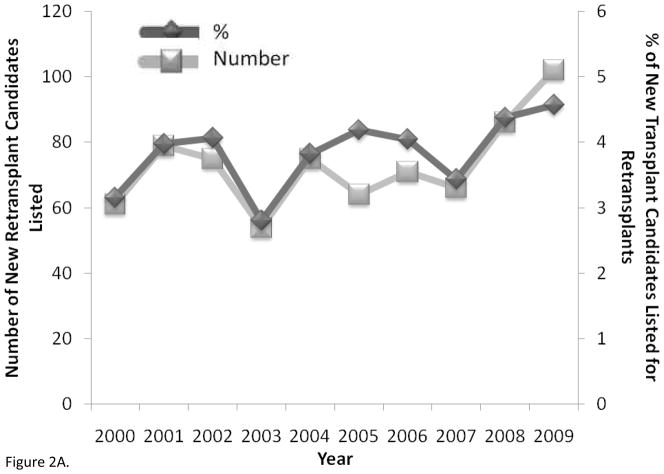
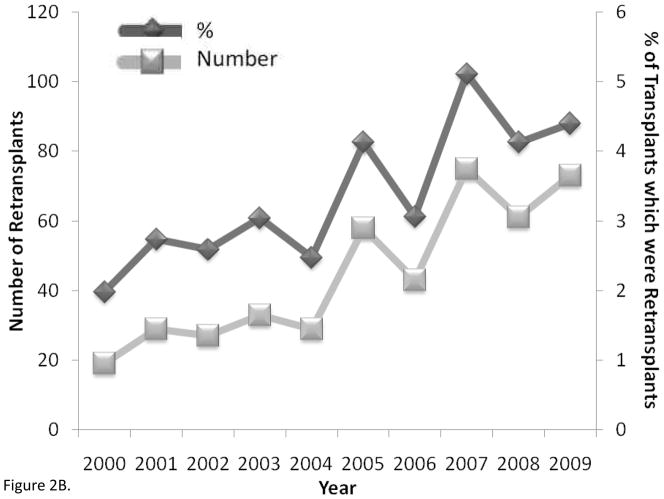
Figure 2.
A) Adult lung retransplantation candidates newly listed (number and % of candidates) (p = 0.10 for associations between number and % with time) and B) adult lung retransplants performed (number and % of total transplants) by year from 2000 to 2009 in the United States (p < 0.001 and p = 0.003 for associations between number and % with time). Data from OPTN as of December 3, 2010, http://optn.transplant.hrsa.gov.


