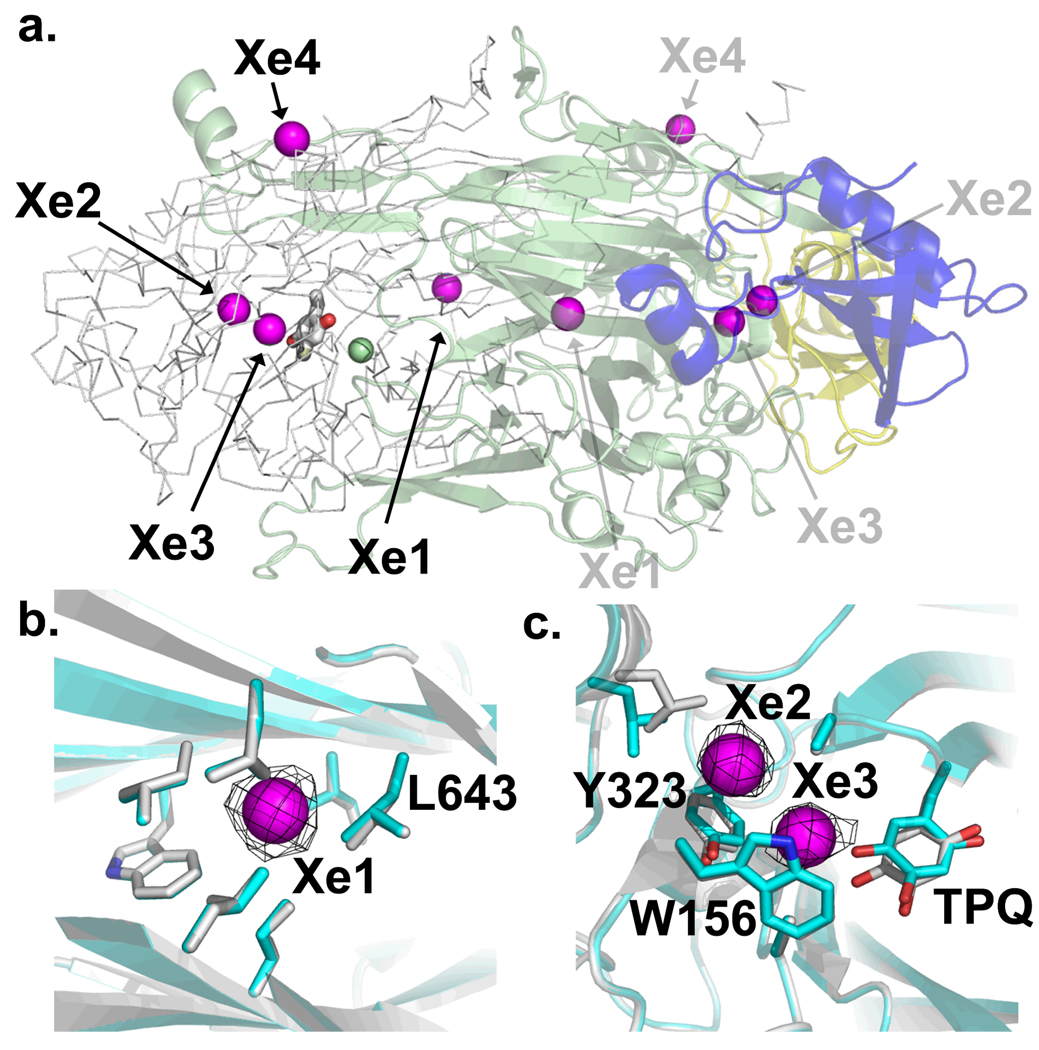
Figure 3.
Xenon binding sites in HPAO. (a) Overall view of the HPAO dimer. One monomer is displayed in cartoon and colored by domain: D1, blue; D2, yellow; and D3, green. The monomer displayed in Cα trace has the TPQ in stick and the copper as a green sphere. Xenons are displayed as magenta spheres and the numbering corresponds to peak size in the anomalous map. (b) Xe1 within the D3 β-sandwich, and (c) Xe2 and Xe3 within the substrate amine channel. The black mesh represents the anomalous map contoured at 9.5 σ. Residues with side-chains within van der Waals contact are displayed. Residues in grey belong to the HPAO + Xe complex, those in blue belong to oxidized HPAO. Figure generated using Pymol (66).

