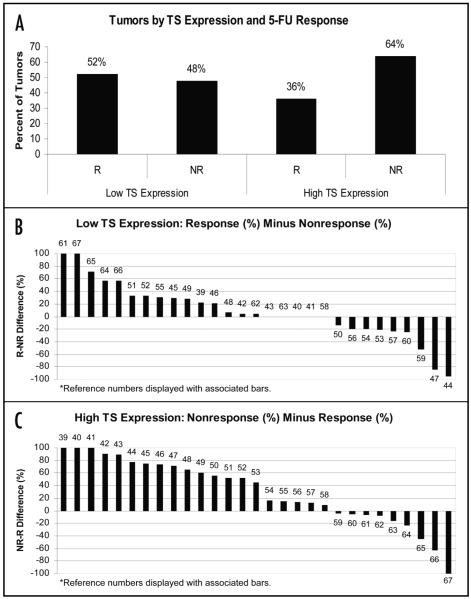
Figure 3.
(A) Cumulative data for tumors organized according to TS expression level and response to 5-FU chemotherapy. For the subset of journals in which articles with an impact factor greater than five, 35% of tumors with high TS expression demonstrate a response to 5-FU versus 53% of tumors with low TS expression. For tumors treated with 5-FU in combination with leucovorin, 83% of tumors with low TS expression had a response to treatment whereas 64% of tumors with low TS expression had no response to this combination treatment. R Response; NR No response. (B) Percent difference of response rates predicted by low TS expression. For tumors with low TS expression from 29 selected papers, the differences between percentages of responders minus non-responders. The differences between these percentages are displayed in descending order. The results above the x-axis support the ability of low TS levels to predict response to 5-FU, while the results below the x-axis contradict this conclusion. Each bar is marked with the reference number of the article it represents. (C) Percent difference of nonresponse rates predicted by high TS expression. For tumors with high TS expression from 29 selected papers, the differences between percentages of non-responders minus responders. The differences between these percentages are displayed in descending order. The results above the x-axis support the ability of high TS levels to predict resistance to 5-FU, while the results below the x-axis contradict this conclusion. Each bar is marked with the reference number of the article it represents.

