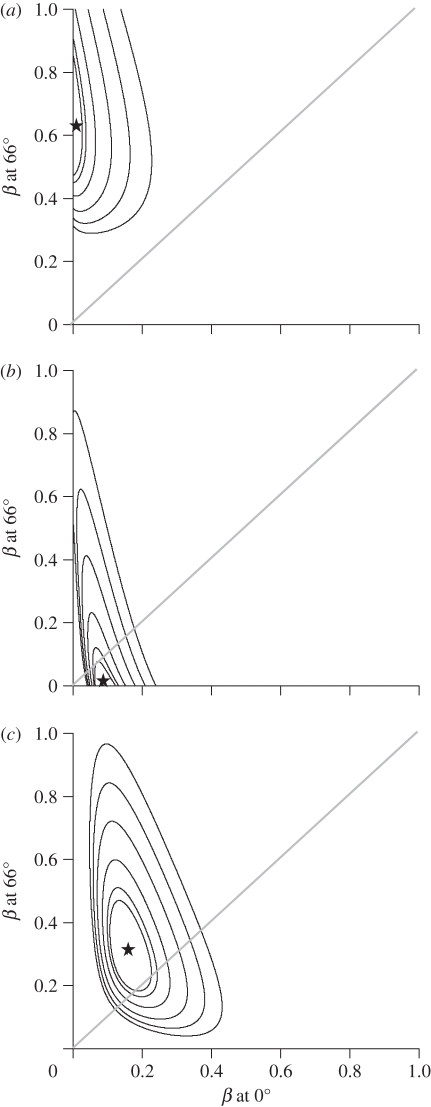
Figure 3.
Likelihood surfaces of evolutionary rate (β) at the equator and at 66° (the extent of our dataset) for the best-supported models in table 1. (a) Oscines syllable diversity (PC2), (b) suboscine syllable diversity (PC2), (c) song length (PC1) for oscines and suboscines combined. Maximum likelihood values shown by stars. Successive contours around maximum likelihood values indicate confidence intervals with increasing values (90%, 95%, 99%, 99.9%, 99.99%, 99.999%). Diagonal line indicates equal rates across the latitude.

