Figure 1.
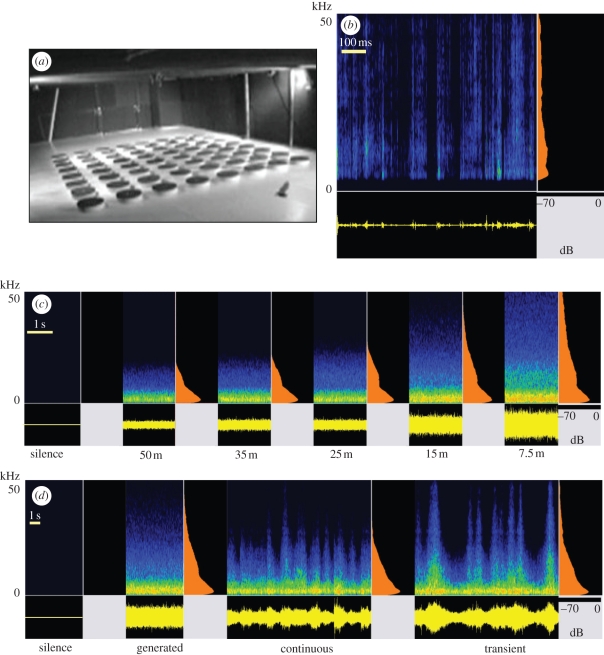
Experimental set-up and sound stimuli. (a) Video screenshot of the experimental foraging area. (b) Example of a carabid beetle walking sound that we used to signal prey to the bats. (c) Noise treatments in experiment 1; ‘silence’ as a control and digitally generated, standardized traffic noise corresponding to different distances to a highway (from the right, i.e. outer, lane. (d) Examples of the noise treatments in experiment 2; the digitally generated 15 m stimulus from experiment 1, recorded traffic noise as 15 m from a highway, but with silent intervals between passing cars cut out, unchanged recorded traffic noise as 15 m from a highway, and again ‘silence’. All sound examples in spectrogram representation with oscillogram below and averaged power spectrum on the right. Amplitude is colour coded (relative dB scale).

