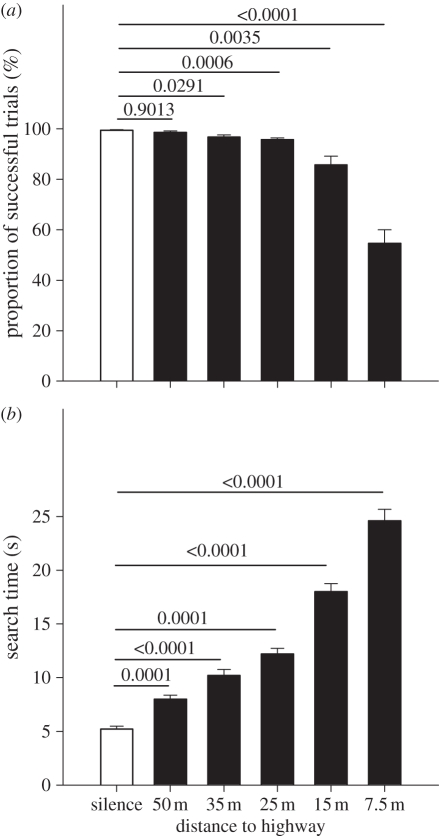
Figure 2.
Foraging performance of the bats under noise conditions of different highway distances (experiment 1). (a) Proportion of successful foraging trials (prey found within a 1 min time window). (b) Search time; i.e. time from onset of prey rustling playback to the moment when the bat landed on the platform (only successful trials included). Means plus one standard error. p-values from paired t-test performed post hoc to a repeated measures ANOVA (see text) are indicated above the bars. We compared each highway distance to the silence treatment (control; white bar); p-values were Bonferroni corrected to account for the five pairwise comparisons. For noise stimuli, see figure 1c.

