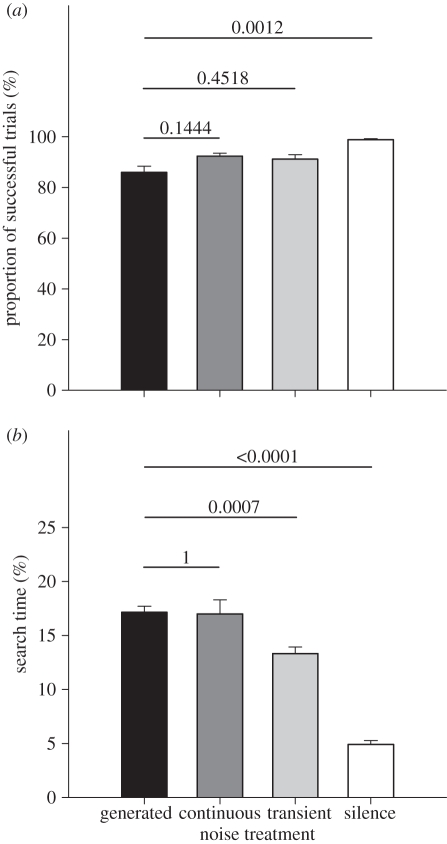
Figure 3.
Foraging performance of the bats under digitally generated and recorded highway noise (experiment 2). (a) Proportion of successful foraging trials. (b) Search time. Means plus one standard error. p-values from paired t-tests performed post hoc to a repeated measures ANOVA (see text) are indicated above the bars. We compared each digitally generated playback stimulus with the 15 m treatment (‘generated’, black bar) as used in experiment 1; p-values were Bonferroni corrected to account for the three pairwise comparisons. For noise stimuli, see figure 1d.

