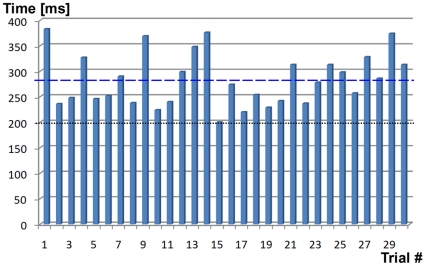
Figure 10. A histogram of the LRT agent's performance at the reaction time task.
The blue bars represent the reaction time in single trials. The figure shows n = 30 trials; the average reaction time is 283 ms. The dashed blue line is LRT's average reaction time; the dotted black line represents human reaction time (200 ms, see Decision Making/Action Selection subsection).

