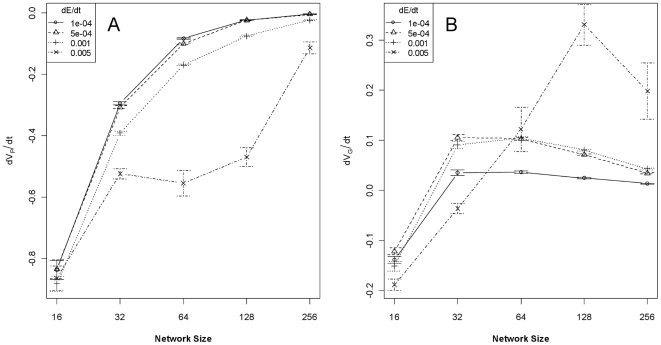
Figure 1. Rates of change of phenotypic and genetic variance as a function of network size and rate of environmental change.
Panel A shows the rates of change (±95% CI) of phenotypic variance during the first 250-generations of simulations, conditional on different-sized gene networks and different rates of environmental change. Panel B shows the rates of change of genotypic variance (±95% CI) during the same time period. Selection at the phenotype-environment interface has a disproportionate affect on VP compared to VG in all but the smallest networks.

