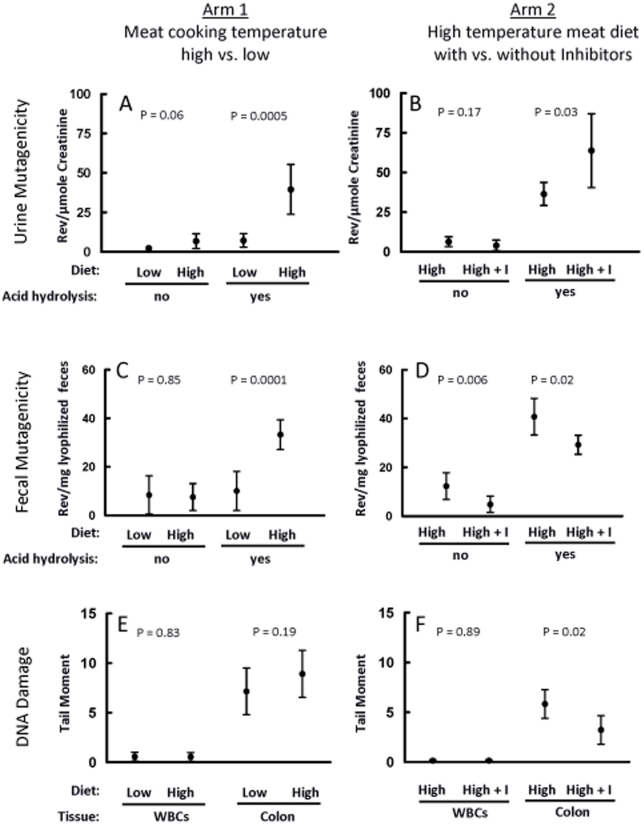
Figure 2. Dietary effects on urine and fecal mutagenicity and on DNA damage.
Each arm had 8 subjects who consumed both diets in a crossover design (Fig. 1); thus each estimate reflects data from 8 subjects. Error bars represent 95% confidence limits of the estimates calculated through the fitted mixed-model and include subject-to-subject variation whereas P-values for diet comparisons utilize smaller within-subject variation. Low = diet with meat fried at low temperature (100°C); High = diet with meat fried at high temperature (250°C); High+I = diet with meat fried at high temperature and inhibitors. Arm 1: Low versus High; Arm 2: High versus High+I. Panels (A) and (B): Estimated mean mutagenicity (rev/µmole creatinine) of hydrolyzed and un-hydrolyzed urine extracts for Arm 1 and Arm 2, respectively. Mutagenicity is adjusted for the creatinine level in each sample. Panels (C) and (D): Estimated mean mutagenicity (rev/mg lyophilized feces) of hydrolyzed and un-hydrolyzed fecal extracts for Arm 1 and Arm 2, respectively. Panels (E) and (F): Estimated mean levels of DNA damage assessed by the comet assay in WBCs and colon epithelial cells for Arm 1 and Arm 2, respectively, based on the average across 4 slides per sample of median Tail Moment on 50 cells per slide.

