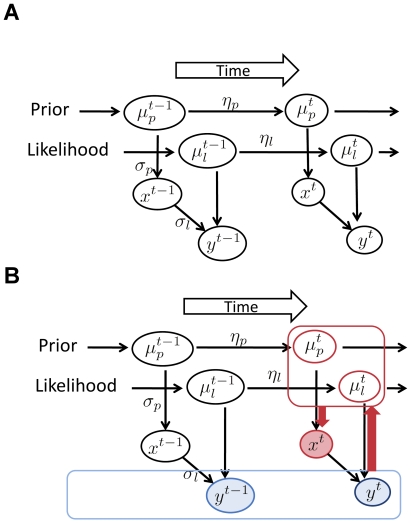
Figure 2. Schematic diagram of our Bayesian model.
A: Physical relations of parameters. Values of variables in circles with superscript t are stochastically determined at time t. The arrows represent causal relations between variables. B: The process of estimation after the observer observes yt at time t. Variables y up to time t (blue color) are directly observed, and others are not observable. The observer's task is to infer xt. For the observer to infer xt, it must also estimate  and
and  .
.

