
Figure 3. Time course of the center point of the psychometric function.

The solid lines show numerical simulation results and the dashed lines show the corresponding analytical results. The two blue lines show the results when 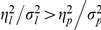 , while the two red lines show the results when
 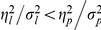 .
.