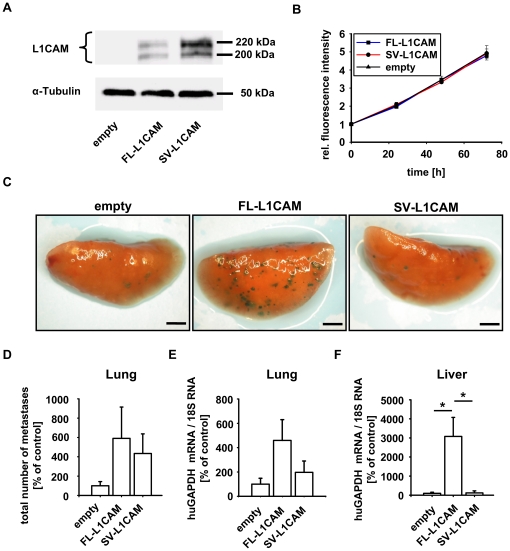
Figure 3. FL-L1CAM promoted the metastatic potential of HT1080lacZ-K15 human fibrosarcoma cells.
HT1080lacZ-K15 cells were transfected with retroviruses coding for FL-L1CAM cDNA or SV-L1CAM cDNA or with an empty vector without transgene. A. Western Blot analysis of L1CAM showed that HT1080lacZ-K15 cells did not express any L1CAM isoform endogenously, whereas expression of FL-L1CAM or SV-L1CAM was detected after gene transfer. The two bands at 220 kDa and 200 kDa are due to differential glycosylation status of L1CAM. B. alamarBlue® proliferation assay did not document any difference in proliferation between the different HT1080lacZ-K15 cell lines. Mean cell number ± SEM (dots ± bars). The mean of the 0 h value within each group was set as 1. Empty: 0 h: 1.000±0.046, 24 h: 2.039±0.037, 48 h: 3.457±0.203, 72 h: 4.950±0.401; FL-L1CAM: 0 h: 1.000±0.014, 24 h: 1.965±0.066, 48 h: 3.458±0.101, 72 h: 4.797±0.164; SV-L1CAM: 0 h: 1.000±0.016, 24 h: 2.096±0.112, 48 h: 3.328±0.031, 72 h: 4.918±0.241. C to E. 21 days after inoculation of 1×10⁶ of the different HT1080lacZ-K15 cells, CD1nu/nu mice were sacrificed, and their lungs and livers were removed. C. X-Gal staining (indigoblue foci) of removed lungs. Representative surface images are presented (bars: 2 mm). D. Mean number of macrometastases in lungs ± SEM (columns ± bars). The mean of the reference group (empty) was set as 100%. Empty: 100.0%±43.3%, n = 6 mice; FL-L1CAM: 554.6%±324.1%, n = 4 mice; SV-L1CAM: 434.0%±202.8%, n = 6 mice (FL-L1CAM vs. empty: p = 0.067; SV-L1CAM vs. empty: p = 0.180; SV-L1CAM vs. FL-L1CAM: p = 0.610, as determined by Mann-Whitney Rank Sum test). E. Mean human GAPDH mRNA levels ± SEM (columns ± bars) in lungs. GAPDH-mRNA levels were normalized to 18S rRNA levels and the mean of the reference group (empty) was set as 100%. Empty: 100.0%±48.4%, n = 6 mice; FL-L1CAM: 459.1%±171.2%, n = 4 mice; SV-L1CAM: 197.1%±92.9%, n = 6 mice (FL-L1CAM vs. empty: p = 0.067; SV-L1CAM vs. empty: p = 0.485; SV-L1CAM vs. FL-L1CAM: p = 0.257, as determined by Mann-Whitney Rank Sum test). F. Mean human GAPDH mRNA levels ± SEM (columns ± bars) in livers. GAPDH mRNA levels were normalized to 18S rRNA levels and the mean of the reference group (empty) was set as 100%. Empty: 100.0%±56.9%, n = 6 mice; FL-L1CAM: 3078.7%±999.7%, n = 4 mice; SV-L1CAM: 121.5%±109.2%, n = 6 mice (FL-L1CAM vs. empty: *p = 0.010; SV-L1CAM vs. empty: p = 1.000; SV-L1CAM vs. FL-L1CAM: *p = 0.019, as determined by Mann-Whitney Rank Sum Test).

