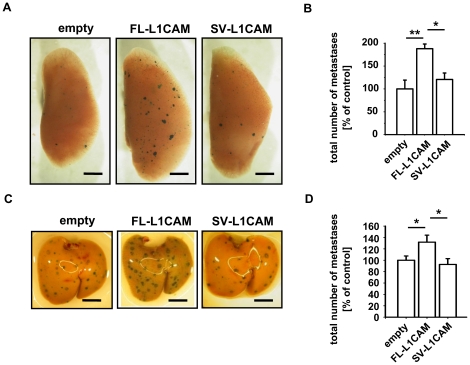
Figure 4. FL-L1CAM also promoted the metastatic potential of SKOV3ip-lacZ human ovarian carcinoma and L-CI.5s murine T-lymphoma cells.
SKOV3ip-lacZ (A and B) as well as L-CI.5s (C and D) cells were stably transduced with retroviruses coding for cDNA of FL-L1CAM or SV-L1CAM or with a retroviral vector without cDNA (empty). A and B. 26 days after inoculation of 1.0×10⁵ of the different SKOV3ip-lacZ cells, CD1nu/nu mice were sacrificed and their lungs were removed. A. X-Gal staining (indigoblue foci) of removed lungs. Representative surface images are presented (bars: 2 mm). B. Mean number of macrometastases in lungs ± SEM (columns ± bars). The mean of the reference group (empty) was set as 100%; n = 4 mice each. Empty: 100.0%±19.1%; FL-L1CAM: 187.8%±10.3%; SV-L1CAM: 120.6%±14.2% (all groups: **p = 0.006, as determined by Kruskal-Wallis One Way ANOVA on Ranks and subsequent post hoc comparison using Dunn's method; pairwise comparisons (unadjusted p values): FL-L1CAM vs. empty: **p = 0.002; SV-L1CAM vs. empty: p = 0.355; SV-L1CAM vs. FL-L1CAM: *p = 0.011). C. and D. 7 days after inoculation of 5×10³ of the different L-CI.5s cells, DBA/2 mice were sacrificed and their livers were removed. C. X-Gal staining (indigoblue foci) of removed livers. Representative surface images are presented (bars: 2 mm). D. Mean number of macrometastases in livers ± SEM (columns ± bars). The mean of the reference group (empty) was set as 100%. Empty: 100.0%±7.5%, n = 10 mice; FL-L1CAM: 131.8%±12.4%, n = 4 mice; SV-L1CAM: 92.6%±10.3%, n = 5 mice (FL-L1CAM vs. empty: *p = 0.029; SV-L1CAM vs. empty: p = 0.200; SV-L1CAM vs. FL-L1CAM: *p = 0.029, as determined by Mann-Whitney Rank Sum test).

