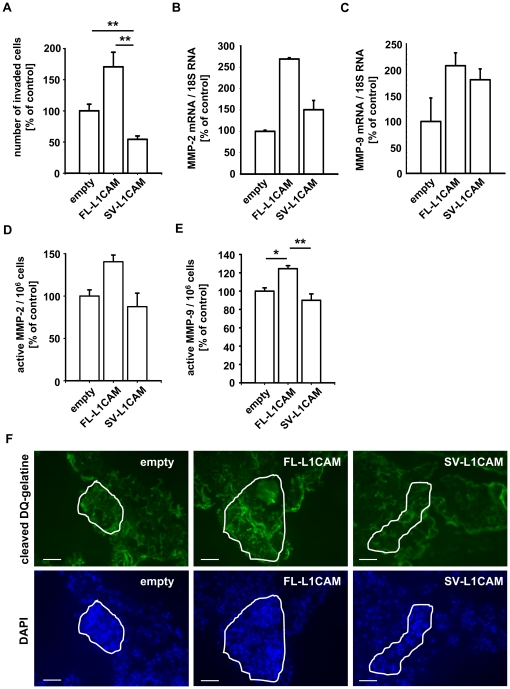
Figure 5. FL-L1CAM over-expression correlated with increased invasive capacity, gelatinase expression and activity in vitro, and gelatinolytic activity in vivo.
HT1080lacZ-K15 cells were stably transduced with retroviruses coding for cDNA of FL-L1CAM or SV-L1CAM or with a retroviral vector without cDNA (empty). A. Mean number of invaded cells per image section ± SEM (columns ± bars) for the different HT1080lacZ-K15 cells. The mean of the reference group (empty) was set as 100%; n = 4. Empty: 100.0%±10.6%; FL-L1CAM: 170.6%±23.5%; SV-L1CAM: 54.3%±5.4% (FL-L1CAM vs. empty: p = 0.057; SV-L1CAM vs. empty: **p = 0.009; SV-L1CAM vs. FL-L1CAM: **p = 0.003; as determined by Mann-Whitney Rank Sum test). B . and C. Mean MMP-2 (B) and MMP-9 (C) mRNA expression levels in the different HT1080lacZ-K15 cells ± SEM (columns ± bars) as quantified by qRT-PCR. The mean of the reference group (empty) was set as 100%; n = 3. B. Empty: 100.0%±2.7%; FL-L1CAM: 269.1%±3.0%; SV-L1CAM: 150.4%±37.6% (FL-L1CAM vs. empty: p = 0.100; SV-L1CAM vs. empty: p = 0.100; SV-L1CAM vs. FL-L1CAM: p = 0.100; as determined by Mann-Whitney Rank Sum Test). C. Empty: 100.0%±45.4%; FL-L1CAM: 207.7%±25.0%; SV-L1CAM: 180.7%±20.9% (FL-L1CAM vs. empty: p = 0.200; SV-L1CAM vs. empty: p = 0.200; SV-L1CAM vs. FL-L1CAM: p = 0.400; as determined by Mann-Whitney Rank Sum Test). Mean MMP-2 (D) and MMP-9 (E) activity of the different HT1080lacZ-K15 cells ± SEM (columns ± bars). The mean of the reference group (empty) was set as 100%. D. Empty: 100.0%±7.3%; FL-L1CAM: 140.4%±7.9%; SV-L1CAM: 87.5%±15.9%; n = 3 (FL-L1CAM vs. empty: p = 0.100; SV-L1CAM vs. empty: p = 0.700; SV-L1CAM vs. FL-L1CAM: p = 0.100; as determined by Mann-Whitney Rank Sum test). E. Empty: 100.0%±3.5%; FL-L1CAM: 124.5%±3.3%; SV-L1CAM: 90.0%±7.0%; n = 3 (all groups: *p = 0.007, as determined by Kruskal-Wallis One Way ANOVA on Ranks and subsequent post hoc comparison using Dunn's method; pairwise comparisons (unadjusted p values): FL-L1CAM vs. empty: *p = 0.013; SV-L1CAM vs. empty: p = 0.201; SV-L1CAM vs. FL-L1CAM: **p = 0.003). F. 21 days after inoculation of 1×10⁶ of the different HT1080lacZ-K15 cells, CD1nu/nu mice were sacrificed and their lungs were removed. In situ zymography was performed on cryo-sections of lungs bearing metastases of the different HT1080lacZ-K15 cells. Representative images are presented (bars: 50 µm; upper row (green signal): degraded DQ-gelatine; lower row (blue signal): DAPI counter-staining).

