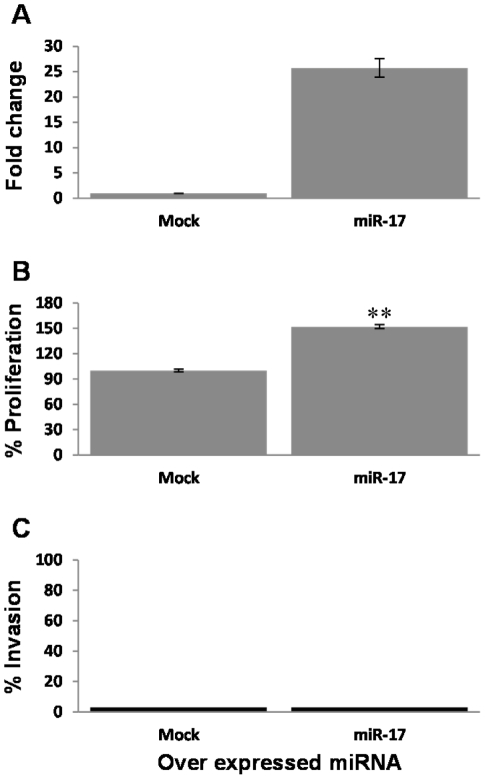
Figure 6. Candidate Oncogenic miRNA enhance proliferation of melanoma cells.
(A) Verification of miR-17-5p over-expression in PAG transductants, as compared to mock-transduced cells. Y-axis denotes fold change above Mock-transduced cells. (B) Net proliferation of the PAG transductants was quantified with standardized XTT test. The number of cells was determined 48 h after seeding. The number of Mock-transductants was determined as 100%. Figure shows a representative experiment out of 3 performed. (C) Invasion activity of PAG transductants was quantified with 20 h-matrigel invasion assay, with correction for proliferation. Y-axis denotes the percentage of invaded cells. Figure shows a representative experiment out of three performed. ** denotes P<0.01 (2-tailed t-test).

