
Figure 2. Contrast sensitivity for detecting the peripheral grating at various temporal frequencies.
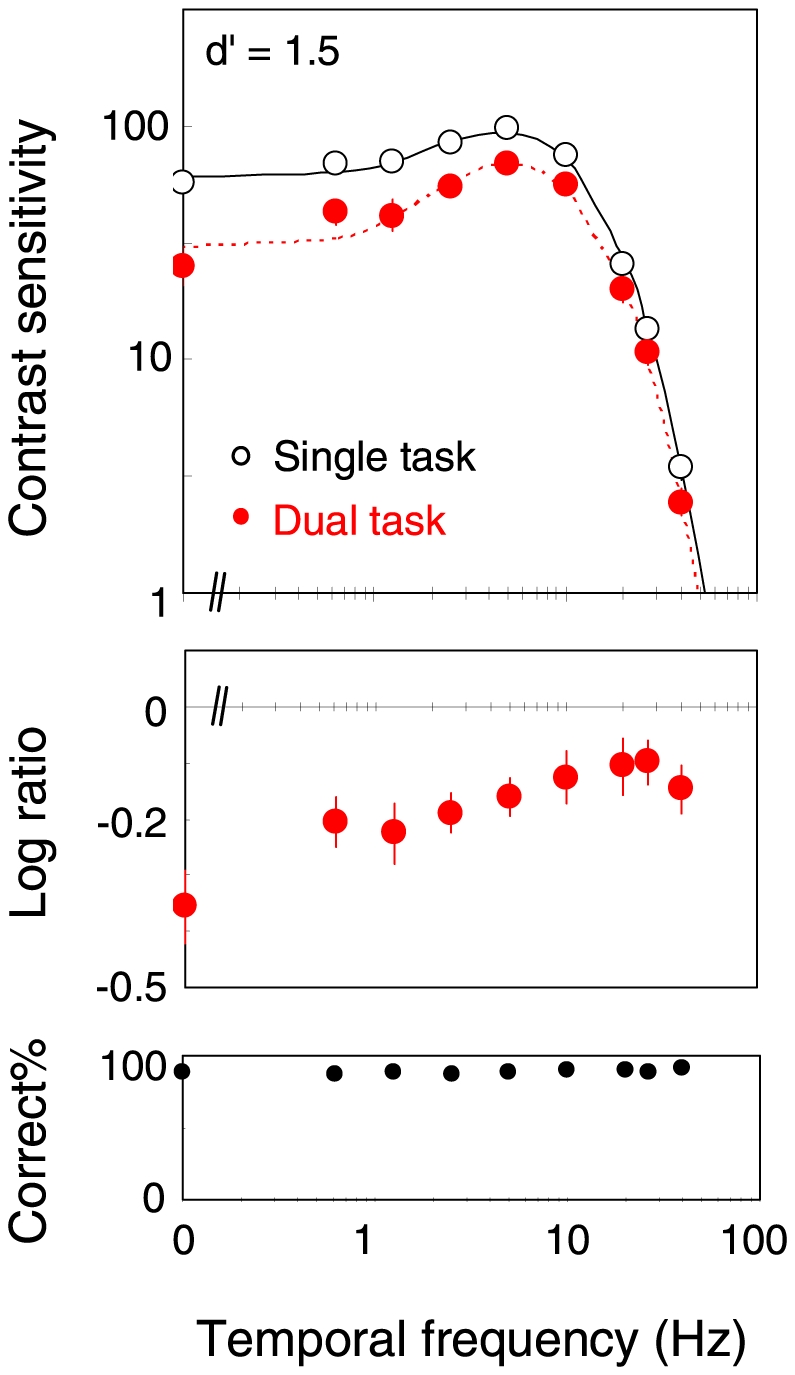
The open circles show the results for the single-task mode, and the red circles the results for the dual-task mode. The middle panel shows the ratio of the sensitivity between the two task modes. The bottom panel shows the proportion correct for the central task. Error bars are +−1 s.e.m. across observers.