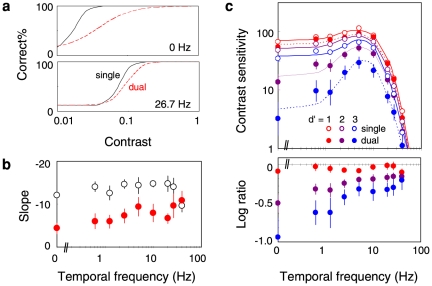
Figure 4. Effect on the slope of psychometric function.
(a) Examples of psychometric functions for the peripheral grating detection. The upper panel shows the results for the static grating (0 Hz) and the lower panel the results for the fast drifting grating (26.7 Hz). The solid curves are the psychometric functions for the single-task mode, and the red dashed curves are those for the dual-task mode. (b) Slope of psychometric functions plotted as a function of the grating temporal frequency. The open circles shows the results for the single-task mode, and the red circles the results for the dual-task mode. Error bars are +−1 s.e.m. across observers. (c) Contrast sensitivity defined with different performance criteria; the red symbols for d′ = 1.0, purple symbols for d′ = 2.0, and blue symbols for d′ = 3.0. The lower panel shows the ratio in the sensitivity between the two task modes. Error bars are +−1 s.e.m. across observers.

