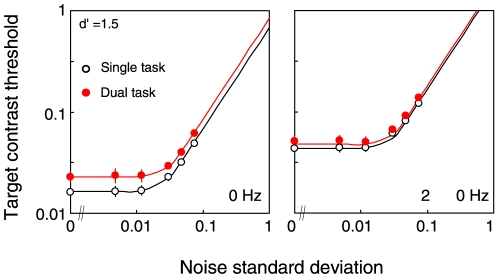
Figure 5. Contrast thresholds for the target grating as a function of the standard deviation of the noise.
The open circles show the results for the single-task mode, and the red circles the results for the dual-task mode. Error bars are +−1 s.e.m. across observers. The left panel shows the results for the static grating (0 Hz); the right panel the results for the drifting grating (20 Hz).

