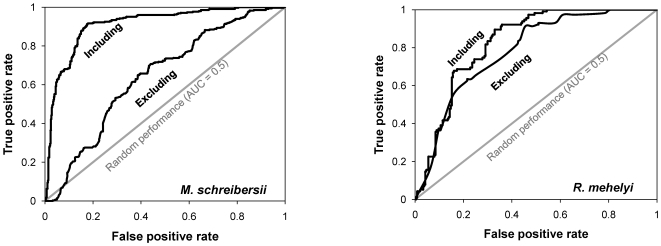
Figure 2. Comparison of the performance between selected models including and excluding distance variables.
The comparison was performed using the area under the ROC curve (AUC). Note the low performance (smaller AUC) of the models that exclude the distance variables, particularly for M. schreibersii (see Table 2 for full model statistics).

