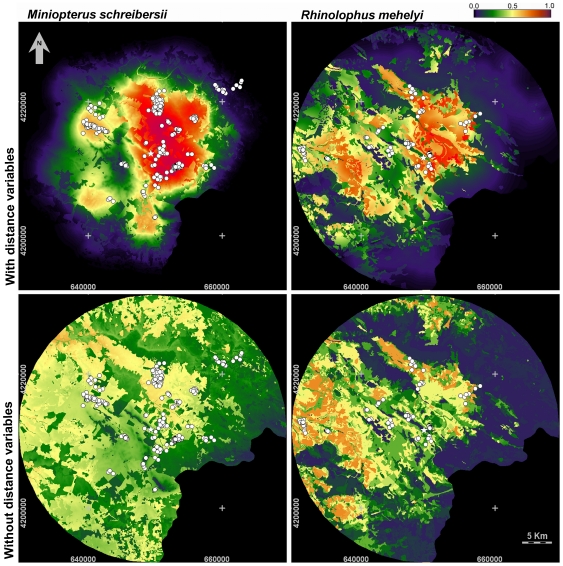
Figure 4. Maps of the predicted foraging suitability of the study area for Miniopterus schreibersii (left) and Rhinolophus mehelyi (right).
These maps were drawn according to the best candidate models including (top) and excluding (bottom) distance variables (see models in Table 2). Habitat suitability is shown on a colour scale ranging from 0 (low suitability) to 1 (high suitability).

