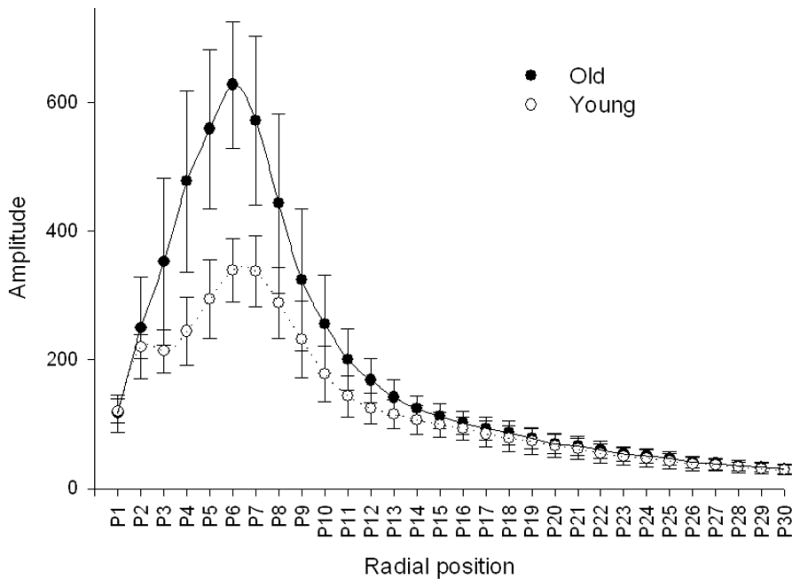
Figure 3.

Radial distribution of analysed structures calculated by Fourier transformation corresponding to their dimensions. The x-axis represents defined bands of spatial frequencies. The y-axis represents the amplitude of particular frequency bands. 30 bands of spatial frequency were defined.
