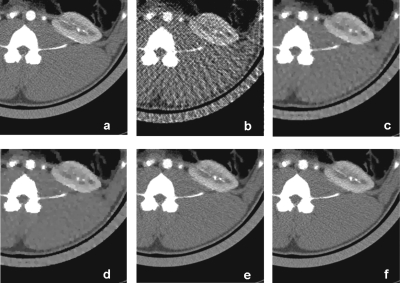
Figure 12.
Comparison of noise texture of (a) original data and reconstructed images using 60 projections and (b) filtered backprojection, (c) CS, (d) NCCS, (e) PICCS, and (f) NCPICCS. Notice both PICCS and NCPICCS preserve the characteristic noise texture of CT images [(e) and (f)] in comparison with smoother images provided by CS and NCCS [(c) and (d)]. Display window is WL=40 HU and WW=350 HU.

