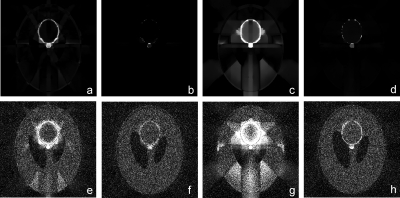
Figure 8.
Absolute error comparison between Shepp–Logan phantom images reconstructed with PICCS [(a), (c), (e), and (g)] and NCPICCS [(b), (d), (f), and (h)]. Figures include noise-free conditions [(a)–(d)] and Poisson noise added to projections [(e)–(h)]. Figures (a), (b), (e), and (f) used six projections and (c), (d), (g), and (h) used four projections. Display window was [0, 0.05], range of original data [0, 1].

