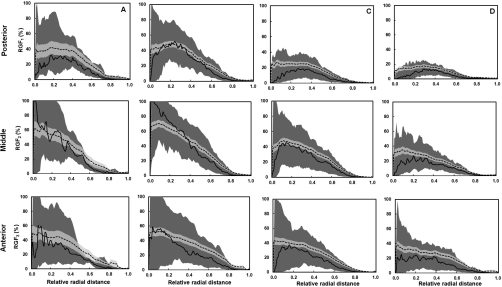
Figure 11.
The radial glandular fraction is plotted as a function of relative radial distance for women with bra cup sizes A, B, C, and D for three breast regions (posterior, middle, and anterior). The dashed line is the mean RGFn and the solid line is the median RGFn. The darker shade covers the range of 25th percentile below and 75th percentile above the median. The lighter shade covers the range of standard error above and below the mean.

