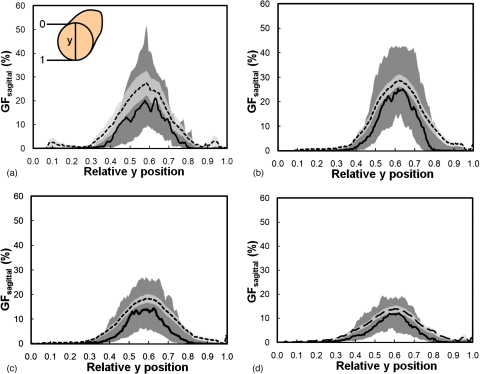
Figure 13.
The glandular fraction of sagittal bCT slices versus the relative y position for women is shown for breasts with bra cup sizes (a) A, (b) B, (c) C, and (d) D. The direction of y position relative to a bCT volume data set is illustrated in A, where 0 is superior and 1 is inferior. The dashed line is the mean GFsagittal and the solid line is the median GFsagittal. The darker shade covers the range of 25th percentile below and 75th percentile above the median. The lighter shade covers the range of standard error above and below the mean.

