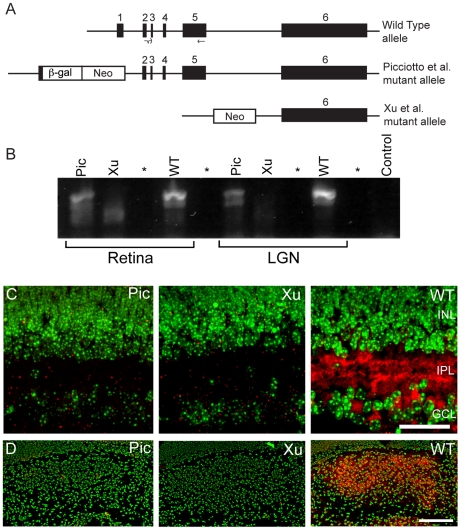
Figure 2. Genotypes and validation of Chrnb2−/− mutants.
A. The structures of the Chrnb2 gene in WT and Pic (Piccotto) and Xu mutants. Exons are numbered solid boxes. The positions of the primers used in (B) are solid black lines and arrows shown below the WT diagram. B. RT-PCR amplifications of Chrnb2 from P4 retinal and LGN mRNA. The forward primer spans the exon 2–3 junction. The reverse primer is located at the 3′ end of exon 5. (see A) Primer sequences are given in Table 1. The expected cDNA product is 1120 bp. Note that Pic mice express some Chrnb2 mRNA while Xu mice do not. This image was made of a 35-cycle amplification to visualize expression in the Pic mice clearly. At 25 cycles the band in the Pic lanes is barely visible (not shown). * indicates an unloaded lane. “Control” is without template. Actin amplification controls are shown in Figure S1. C. Confocal images of retinal tissue using an antibody to CHRNB2 (sc-1449). INL; inner nuclear layer; IPL, inner plexiform layer; GCL; ganglion cell layer. Scale 50 µm. D. Confocal images of P4 LGN tissue using an antibody to CHRNB2 (sc-1449). The region occupied by the LGN expresses CHRNB2. Scale 200 µm. In C and D, DAPI counterstain is pseudocolored green and anti-CHRNB2 is red.

