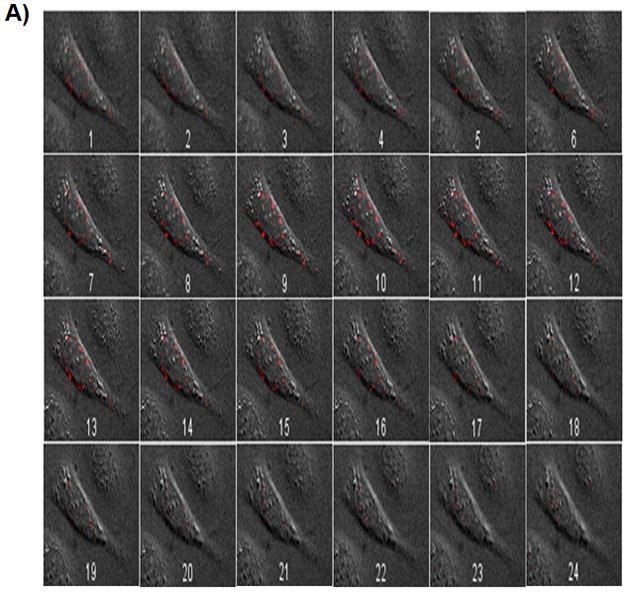
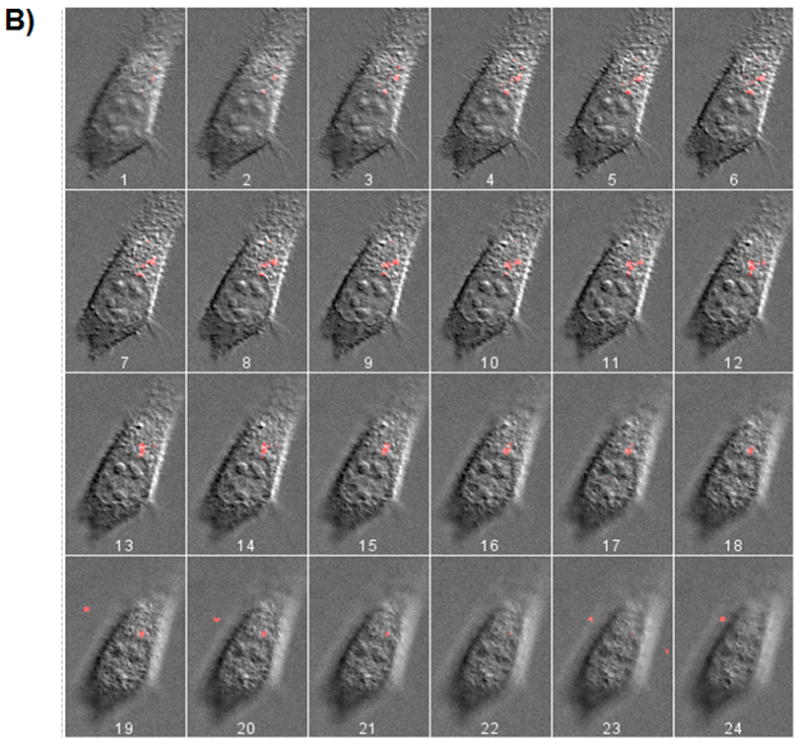
Figure 5.


Z-stack images taken from SKOV-3 cells transfected with FDNT/pDNA (A), and FDT/pDNA (B) nanoparticles. pDNA (pEGFP) was labeled with Cy3 dye and used to complex with biopolymers. Z-stack images 7 to 12 (inside the cell) show the highest levels of nanoparticle fluorescence intensity.
