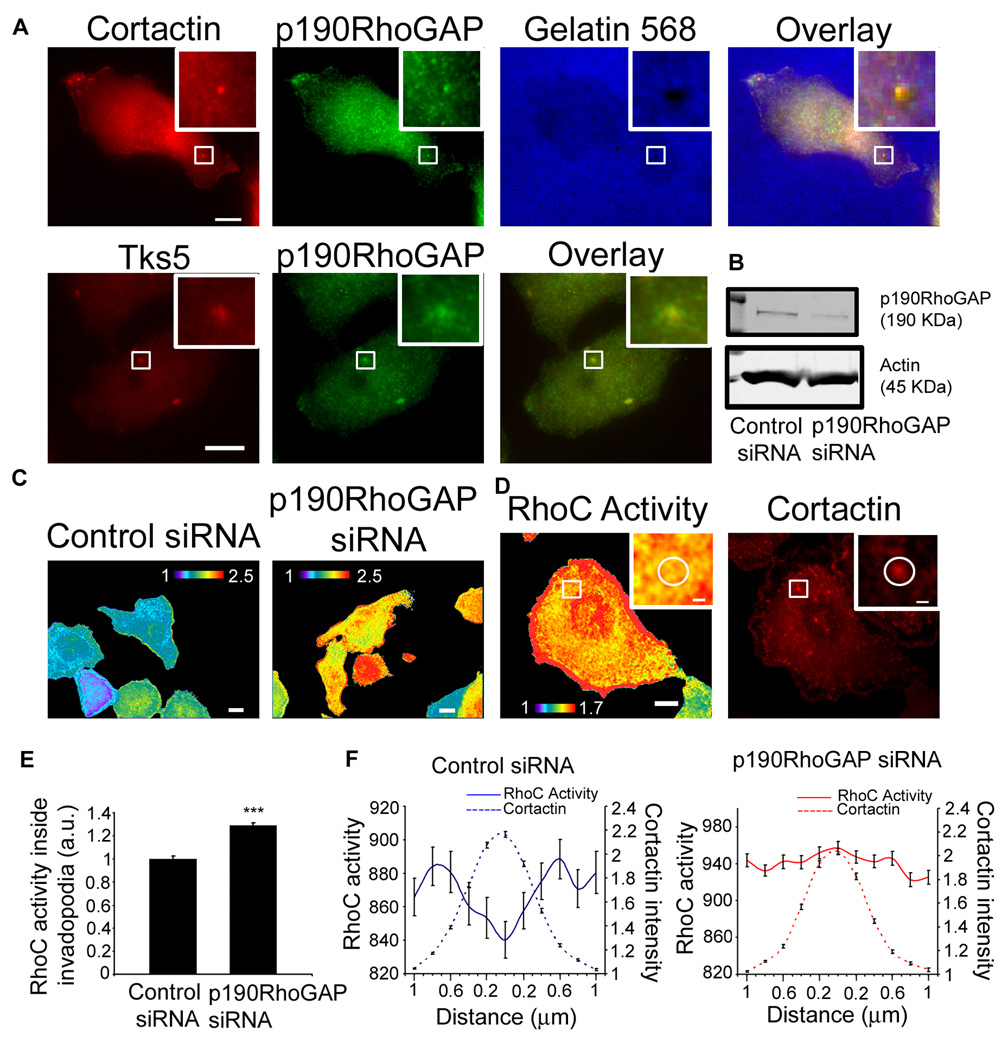
Figure 3. p190RhoGAP localization at invadopodia and regulation of RhoC activity.
a) Representative images of MTLn3 cells plated on a gelatin matrix and stained for cortactin, Tks5 and p190RhoGAP. b) Western blot of cell lysates from MTLn3 cells transfected with control siRNA or p190RhoGAP siRNA blotted for p190RhoGAP and β-actin. c) Representative images of RhoC activity in cells transfected with control or p190RhoGAP siRNA. d) Representative image of RhoC activity in p190RhoGAP siRNA cells and stained for cortactin. e) Quantification of RhoC activity inside invadopodium. n = 30 invadopodium per group from 3 independent experiments. f) Linescan measurements of RhoC activity and cortactin intensity along invadopodium. n = 30 invadopodium per group from 3 independent experiments. ***, p < 0.001. Scale bar = 10 µm; inserts scale bar = 1 µm.

