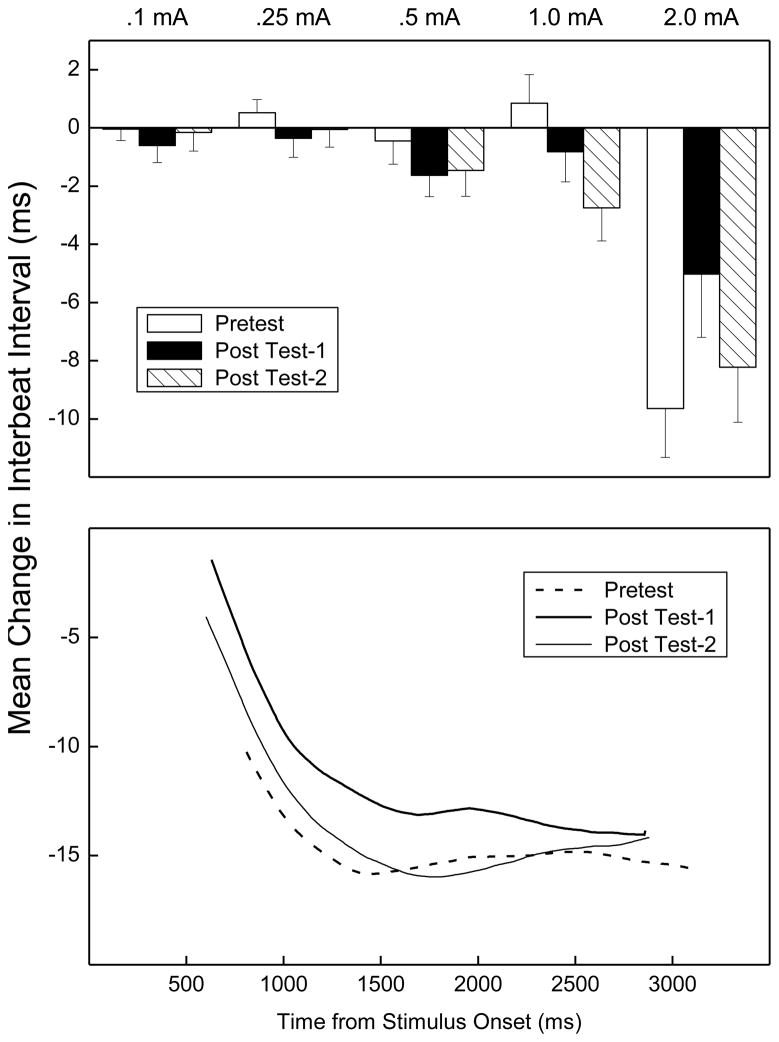
Figure 3.
The top panel depicts overall mean (±SEM) change in the inter-beat interval (IBI) between a 2000-ms baseline interval before and 2000-ms interval after unconditioned stimulus (US) onset during US testing on Pretest, Post Test-1 and Post Test-2 for five US intensities (0.1, 0.25, 0.5, 1.0 and 2.0 mA) collapsed across US duration. A reduction in IBI (from baseline) represents heart rate acceleration. The bottom panel shows the average topography of changes in IBI to the 2-mA US for a period of 3000 ms following US onset from a 2000-ms baseline period before the US.

