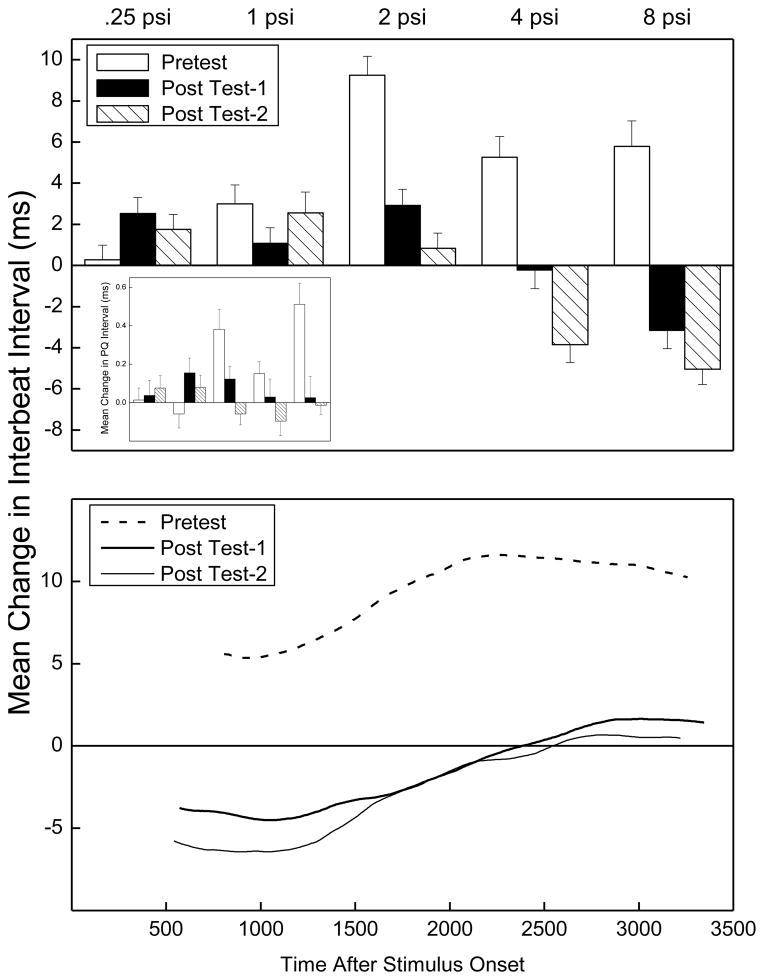
Figure 6.
The top panel illustrates the overall mean (±SEM) change in the inter-beat interval (IBI) between a 2000-ms baseline interval before and 2000-ms interval after unconditioned stimulus (US) onset during US testing on Pretest, Post Test-1 and Post Test-2 for five US intensities ( 0.5, 1, 2, 4, and 8 psi) collapsed across US duration. A reduction in IBI (from baseline) represents heart rate acceleration. The inset shows changes in the PQ interval for the IBI data depicted in the top panel. The bottom panel shows the average topography of changes in IBI to the 8-psi US for a period of 3000 ms following US onset from a 2000-ms baseline period before the US.

