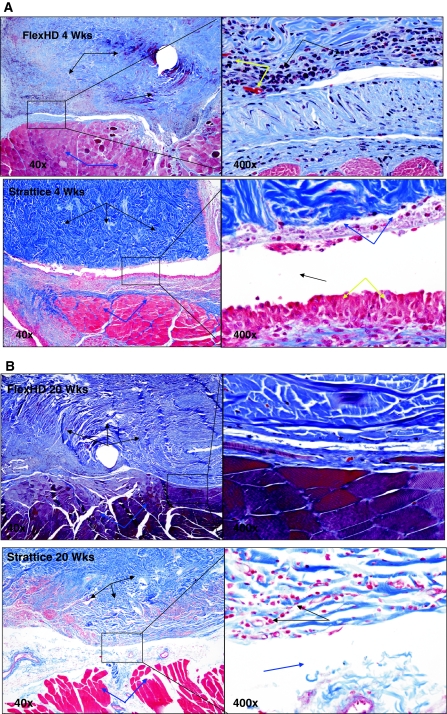
Fig. 4.
Representative photomicrographs: see the Raw Data for individual descriptions of samples. The photomicrographs below are meant to be representative of the group data generated for the studies. A Representative photomicrographs of FlexHD and Strattice hernia repair implants at 4 weeks post-implantation. Photos are from the interface between the implant (black arrows) and the host skeletal muscle (blue arrows). Integration of the host tissue and the implant is modest in both groups at this early time point, though the FlexHD appears slightly better. Notice the wide tissue gap (bottom right, black arrow) in the Strattice implant that is lined by a layer of macrophages (yellow arrows) and degenerate cellular debris (blue arrows). While there is also inflammation in the FlexHD sample (top right, black arrows) there is better tissue integration and an infiltration of small capillaries (top right, yellow arrows). Trichrome stain; 40× and 400× magnification. B Representative photomicrographs of FlexHD and Strattice hernia repair implants at 20 weeks post-implantation. Photos are from the interface between the implant (black arrows) and the host skeletal muscle (blue arrows). Integration of the host tissue and the implant is good in the FlexHD sample with few tissue gaps and minimal inflammation. Integration of the host tissue and the implant is still minimal in the Strattice implant; notice the tissue gaps (bottom right, blue arrow) and persistence of inflammation (bottom right, black arrows). Trichrome stain; 40× and 400× magnification

