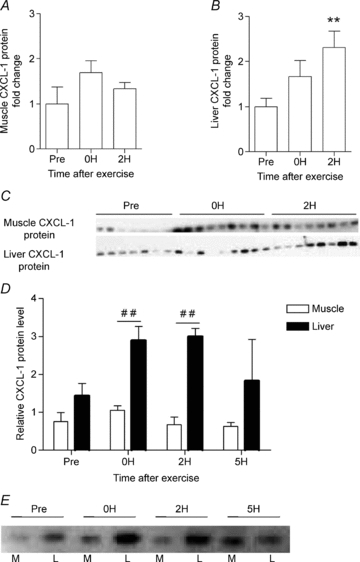
Figure 3. Exercise increases CXCL-1 protein in liver but not muscle.

NMRI mice performed a single bout of exercise and were killed immediately (0 h), or at 2 (2H) or 5 h (5H). One group did not exercise (Pre) 5H only shown in panels D and E. CXCL-1 protein expression (Western blotting) was determined separately in muscle (A) and liver (B) tissue (n = 8). Statistical analysis of CXCL-1 protein expression in each tissue was performed using one-way ANOVA followed by intergroup comparison by Tukey's post hoc test with correction for multiple testing. ** indicates significance at P < 0.01 from pre-exercise level (Pre). The two corresponding CXCL-1 protein blots for liver and the muscle are showed in (C). Comparison of the relative level of CXCL-1 protein expression in muscle and liver at the different time points before and after exercise are illustrated in (D), with the representative protein blot shown in E (n = 3). Statistical analysis was performed by two-way ANOVA with intergroup comparison by Bonferroni's post hoc test. ## indicates statistical significance between muscle and liver tissue at the respective time points. All CXCL-1 protein levels are normalised to the corresponding level of Reactive Brown. The relative protein expression is presented as fold change values in proportion to the control (Pre) expression level. Fold change values are depicted as means ±s.e.m.
