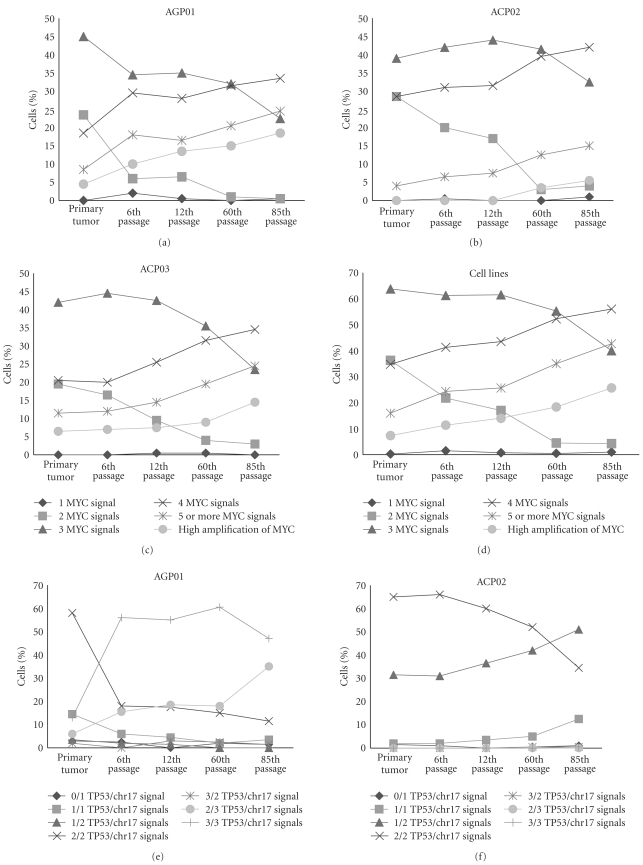
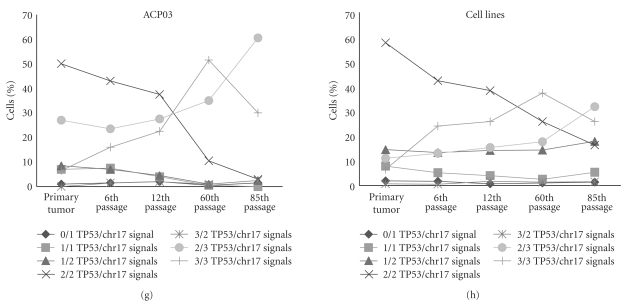
Figure 2.
Distribution of cells according to (a) MYC signals in AGP01 parental tumor and cell line passages; (b) MYC signals in ACP02 parental tumor and cell line passages; (c) MYC signals in ACP03 parental tumor and cell line passages; (d) mean of MYC signals of AGP01, ACP02, and ACP03 parental tumor and cell line passages; (e) TP53/chr17 signals in AGP01 parental tumor and cell line passages; (f) TP53/chr17 signals in ACP02 parental tumor and cell line passages; (g) TP53/chr17 signals in ACP03 parental tumor and cell line passages; (h) mean of TP53/chr17 signals of AGP01, ACP02, and ACP03 parental tumor and cell line passages.


