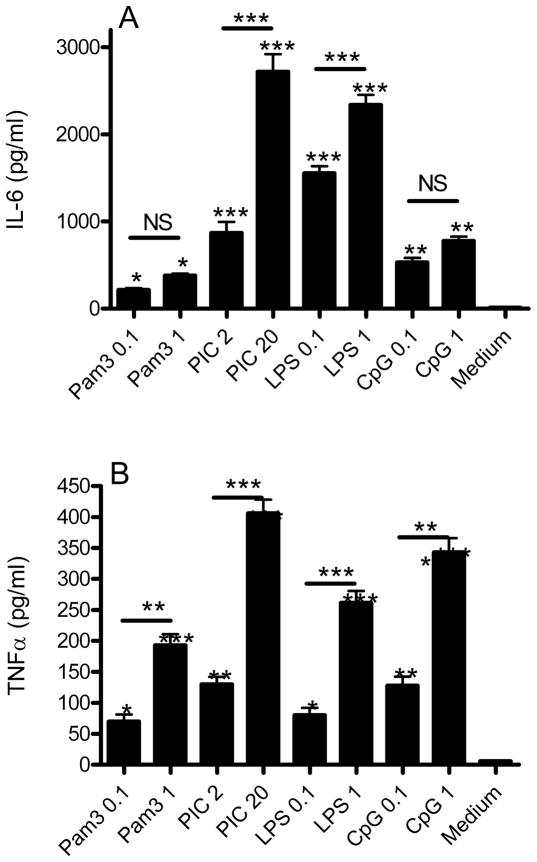
Figure 1.
WT murine primary microglia were incubated with medium or with two different concentrations of activators specific for TLR2 (Pam3), TLR3 (PIC), TLR4 (LPS), or TLR9 (CpG) for 18 hr and then medium concentrations (pg/ml) of IL-6 (A) and TNFα (B) quantified. Data are average concentration ± SEM (n=3). ANOVA for both analytes had P < 0.0001 and Bonferroni-corrected paired comparisons for each condition with medium only noted above the column. Horizontal lines indicate Bonferroni-corrected paired comparisons between the two concentrations of each TLR activator (*P < 0.05, **P < 0.01, ***P<0.001)

