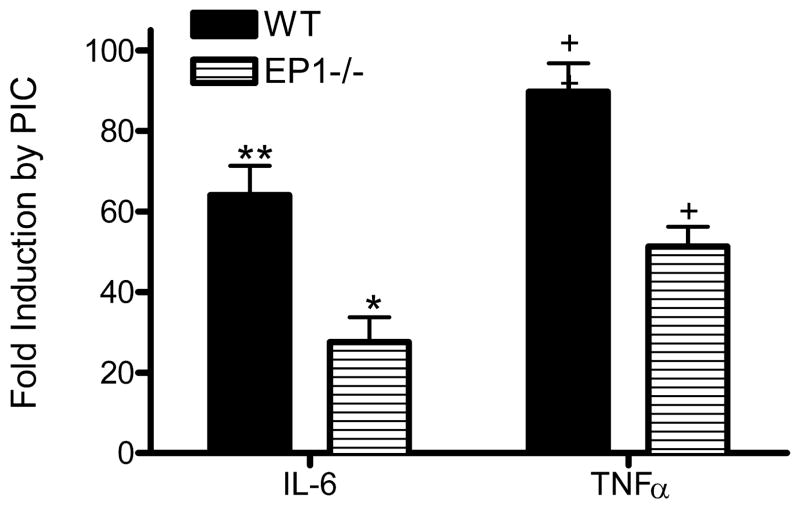
Figure 6.
WT or EP1−/− murine primary microglia were incubated with vehicle or 20 μg/ml PIC starting for 18 hr when medium concentrations of IL-6 and TNFα were quantified. Shown are average fold induction ± SEM (n=3) by PIC over vehicle control for both analytes and genotypes. Two-way ANOVA was performed on concentrations of each analyte: Medium vs. PIC and WT vs. EP1−/−. Results of two-way ANOVA for IL-6 concentration had *P < 0.01 for genotype, **P < 0.001 for exposure group, and P < 0.01 for interaction between these two terms. Results of two-way ANOVA for TNFα concentration had +P < 0.01 for genotype, ++P < 0.001 for exposure group, and P < 0.01 for interaction between these two terms.

