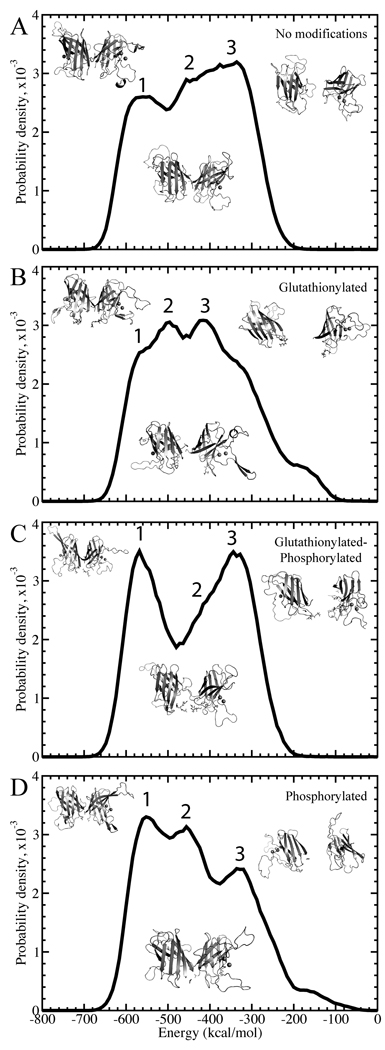
Figure 2. Deciphering the states for wild type.
Distributions of total potential energies are shown with a solid curve. Potential energy is sampled throughout the simulations, at temperatures of 0.55–0.65 kcal/mol•kB, for (A) unmodified, (B), glutathionylated, (C) glutathionylated-phosphorylated, and (D) phosphorylated cases of SOD1. The three Gaussian-like curves are highlighted for each species. Representative structures for each of the three states in each species are shown to the right of each plot.

