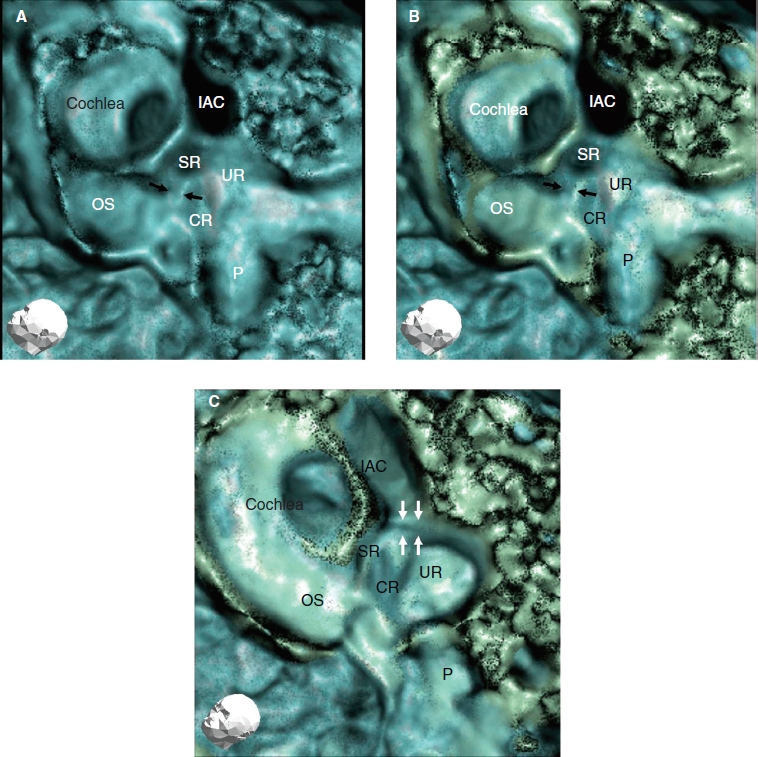
Figure 3.

Findings of a representative 3D CT image of a healthy human subject (left ear). (A) With low-level bone CT window (blue color). (B) With low - and high- level bone CT windows (blue and green color). (C) The image shows a view from directly above the sulciform groove with the same CT window level as in (B). A more accurate image of the sulciform groove of the saccular duct and endolymphatic sinus can be judged by referring to the CT images in (A, B, and C) The method in (C) is suitable for assessment of the sulciform groove of the saccular duct and endolymphatic sinus. With two different bone densities the CT view manifests more three-dimensionally. The cochlear lateral wall and basal portion of the osseous spiral lamina in green seem to be denser in bone density than the vestibule and the apex of the cochlea in blue. CR, cochlear recess; IAC, internal auditory canal; OS, osseous spiral lamina; P, posterior semicircular canal; SR, saccular recess; UR, utricular recess. Black arrows, YT groove; white arrows, the sulciform groove of the saccular duct and endolymphatic sinus.
