
Figure 2.
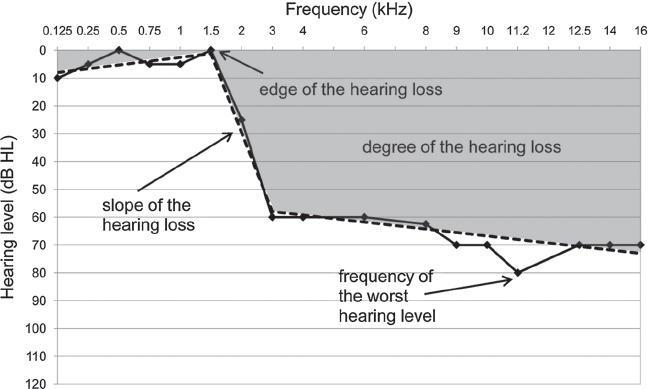
An example of the ‘broken-stick’ function fi tted to the audiometric data. The solid line shows individual patient's hearing level and the broken line shows non-linear regression with two breaks (the best fit for that hearing profile). The ‘broken stick’ function was used to quantify the audiometric edge, slope, degree of hearing loss (shaded area). Frequency of the worst hearing level was also identifi ed.