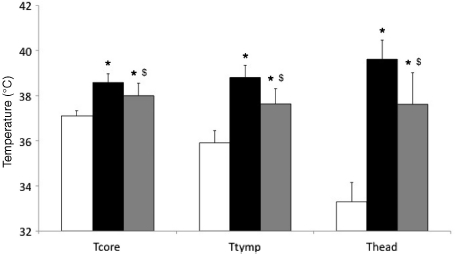
Figure 1.

Average temperatures in control (CON, white bars), hot (HOT, black bars) and hot head cool (HHC, grey bars) conditions during cognitive testing. Tcore, intestinal temperature; Ttymp, tympanic temperature; Thead, skin temperature on forehead. *Significant higher values than in CON (P< 0.001); $significant lower values than in HOT (P< 0.001).
