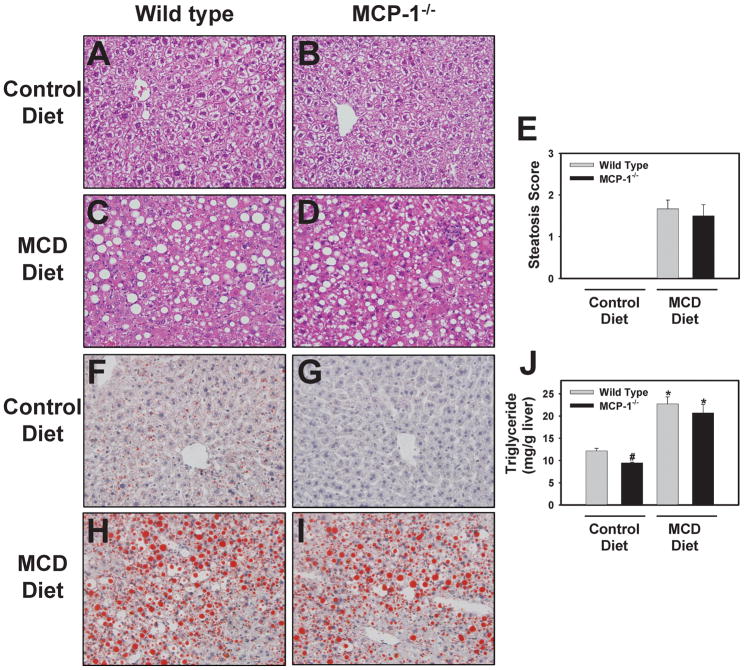
Figure 2. Effect of MCP-1-deficiency on liver histology and triglyceride levels in mice fed the MCD diet.
MCP-1-deficient and wild type mice, both on the C57Bl/6J genetic background, were fed either control diet or MCD diet for 28 days. Representative photomicrographs showing H&E-stained liver sections (A–D) and Oil Red O-stained liver sections (F–I) from wild type mice fed control diet (A,F) or MCD diet (C,H) and from MCP-1-deficient mice fed control diet (B, G) or MCD diet (D, I). (E) H&E-stained slides were evaluated by a pathologist and assigned a macrovesicular steatosis severity score. (J) Hepatic triglyceride levels were determined as described in Methods. Data are expressed as mean ± SEM. N = 4 wild type mice fed control diet, 3 MCP-1−/− mice fed control diet, 8 wild type mice fed MCD diet, and 6 MCP-1−/− mice fed MCD diet. *Significantly different from mice of the same genotype fed control diet. #Significantly different from wild type mice fed the control diet.

